Exhibit 99.2
The Leading Concrete Pumping Provider in the U.S. and U.K. NASDAQ: BBCP January 2019 Investor Presentation
Important Information This investor presentation (“Investor Presentation”) is for informational purposes only and does not constitute an offer to s ell , a solicitation of an offer to buy, or a recommendation to purchase any equity, debt or other financial instruments of Concrete Pumping Holdings, Inc. (the “Company”) or any of the Company’s affiliates. It is n ot intended to form the basis of any investment decision. The information contained herein does not purport to be all - inclusive. The data contained herein is derived from various internal and external sources. No representation is made as to the reasonableness of the assumptions made within or the accuracy or completeness of any projections or modeling or any other information contained herein. Any data on pas t performance or modeling contained herein is not
Important Information This investor presentation (“Investor Presentation”) is for informational purposes only and does not constitute an offer to s ell , a solicitation of an offer to buy, or a recommendation to purchase any equity, debt or other financial instruments of Concrete Pumping Holdings, Inc. (the “Company”) or any of the Company’s affiliates. It is n ot intended to form the basis of any investment decision. The information contained herein does not purport to be all - inclusive. The data contained herein is derived from various internal and external sources. No representation is made as to the reasonableness of the assumptions made within or the accuracy or completeness of any projections or modeling or any other information contained herein. Any data on pas t performance or modeling contained herein is not an indication as to future performance. The Company assumes no obligation to update the information in this Investor Presentation. Forward - Looking Statements This Investor Presentation includes “forward - looking statements” within the meaning of the “safe harbor” provisions of the Priva te Securities Litigation Reform Act of 1995. The Company’s actual results may differ from its expectations, estimates and projections and consequently, you should not rely on these forward - looking statement s as predictions of future events. Words such as “expect,” “estimate,” “project,” “budget,” “forecast,” “anticipate,” “intend,” “plan,” “may,” “will,” “could,” “should,” “believes,” “predicts,” “potential,” “co ntinue,” and similar expressions are intended to identify such forward - looking statements. These forward - looking statements involve significant risks and uncertainties that could cause the actual results to differ mater ially from the expected results. Most of these factors are outside the Company’s control and are difficult to predict. Factors that may cause such differences include, but are not limited to: the outcome of an y legal proceedings that may be instituted against the Company; the inability to obtain or maintain the listing of the Company’s shares of common stock on The Nasdaq Stock Market; the risk that the Company’ s r ecently consummated business combination (the “business combination”) disrupts current plans and operations; the ability to recognize the anticipated benefits of the business combination, which m ay be affected by, among other things, competition, the ability of the Company to grow and manage growth profitably and retain its key employees; costs related to the business combination; changes in applica ble laws or regulations; the possibility that the Company may be adversely affected by other economic, business, and/or competitive factors; and other risks and uncertainties indicated from time to ti me in the Company’s filings with the U.S. Securities and Exchange Commission. The Company cautions that the foregoing list of factors is not exclusive. The Company cautions readers not to place undue rel ian ce upon any forward - looking statements, which speak only as of the date made. The Company does not undertake or accept any obligation or undertaking to release publicly any updates or revisions to any forward - looking statements to reflect any change in its expectations or any change in events, conditions or circumstances on which any such statement is based. Industry and Market Data In this Investor Presentation, we rely on and refer to information and statistics regarding market participants in the sector s i n which the Company competes and other industry data. We obtained this information and statistics from third - party sources, including reports by market research firms, and company filings. Non - GAAP Financial Measures This Investor Presentation includes financial measures that were not calculated in accordance with Generally Accepted Accounting Principles in the U.S. (“ GAAP ”), including Adjusted Revenue Pro Forma for Acquisitions, Adjusted EBITDA Pro Forma for Acquisitions, and Adjusted EBITDA Margin Pro Forma for Acquisitions. The Company def ines Adjusted Revenue Pro Forma for Acquisitions as revenue after giving pro forma effect to (i) the acquisition on November 17, 2016 of Camfaud Concrete Pumps Limited, and Premier Concrete P ump ing Limited, which each also owned 50% of the stock of South Coast Concrete Pumping Limited (collectively “Camfaud” and the acquisition, the “Camfaud Acquisition”), and (ii) the acquisition on Ap ril 20, 2018 of substantially all assets of Richard O’Brien Companies, Inc., O’Brien Concrete Pumping - Arizona, Inc., O’Brien Concrete Pumping - Colorado, Inc. and O’Brien Concrete Pumping, LLC (collectively, “O’Brien” and the acquisition, the “O’Brien Acquisition”), as further adjusted to reflect a constant a currency exchange rate. Pre - acquisition financial results of Camfaud and O’Brien are labeled “pre - acquisition.” Post - acquisition financial results for t hese companies are consolidated within the Company’s financial statements for periods following the date of acquisition. Adjusted EBITDA Pro For ma for Acquisitions is defined as net income (loss) plus interest expense, income taxes, depreciation, amortization, transaction expenses, loss on debt extinguishment, other income (expense), non - recurri ng adjustments and management fees. Adjusted EBITDA Margin Pro Forma for Acquisitions is Adjusted EBITDA Pro Forma for Acquisitions divided by Adjusted Revenue Pro Forma for Acquisitions. These mea sures should not be used as substitutes for their most comparable measures calculated in accordance with GAAP. See Reconciliation of Non - GAAP Measures on Slide 31. The Company believes that these non - GAAP measures of financial results provide useful information to management and investors re garding certain financial and business trends relating to the Company’s financial condition and results of operations. The Company’s management uses certain of these non - GAAP measures to compare the C ompany’s performance to that of prior periods for trend analyses and for budgeting and planning purposes. You should review the Company’s audited financial statements and not rely on any single financial measure to evaluate the Company ’s business. Other companies may calculate Adjusted EBITDA, Adjusted EBITDA Margin and other non - GAAP measures differently, and therefore the Company’s Adjusted EBITDA Pro Forma for Acquisitions, Adjusted EBITDA Margin Pro Forma for Acquisitions and other non - GAAP measures may not be directly comparable to similarly titled measures of other companie s. Disclaimer 1
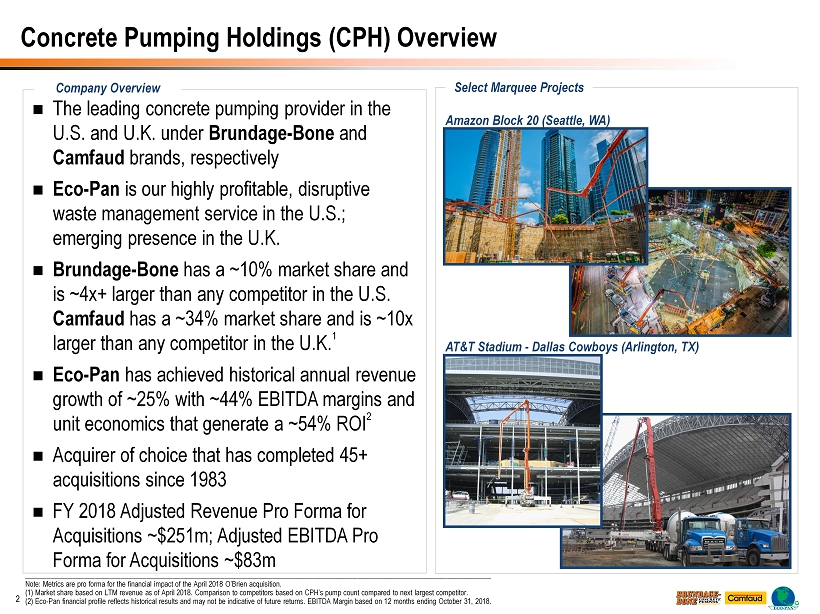
Concrete Pumping Holdings (CPH) Overview The leading concrete pumping provider in the U.S. and U.K. under Brundage - Bone and Camfaud brands, respectively Eco - Pan is our highly profitable, disruptive waste management service in the U.S.; emerging presence in the U.K. Brundage - Bone has a ~10% market share and is ~4x+ larger than any competitor in the U.S. Camfaud has a ~34% market share and is ~10x larger than any competitor in the U.K. 1 Eco - Pan has achieved historical annual revenue growth of ~25% with ~44% EBITDA margins and unit economics that generate a ~54% ROI 2 Acquirer of choice that has completed 45+ acquisitions since 1983 FY 2018 Adjusted Revenue Pro Forma for Acquisitions ~$251m; Adjusted EBITDA Pro Forma for Acquisitions ~$83m 2 Amazon Block 20 (Seattle, WA) AT&T Stadium - Dallas Cowboys (Arlington, TX) _____________________________________________________________________________________________________________________________ _ Note: Metrics are pro forma for the financial impact of the April 2018 O’Brien acquisition. (1) Market share based on LTM revenue as of April 2018. Comparison to competitors based on CPH’s pump count compared to next lar gest competitor. (2) Eco - Pan financial profile reflects historical results and may not be indicative of future returns. EBITDA Margin based on 12 months ending October 31, 2018. Select Marquee Projects Company Overview
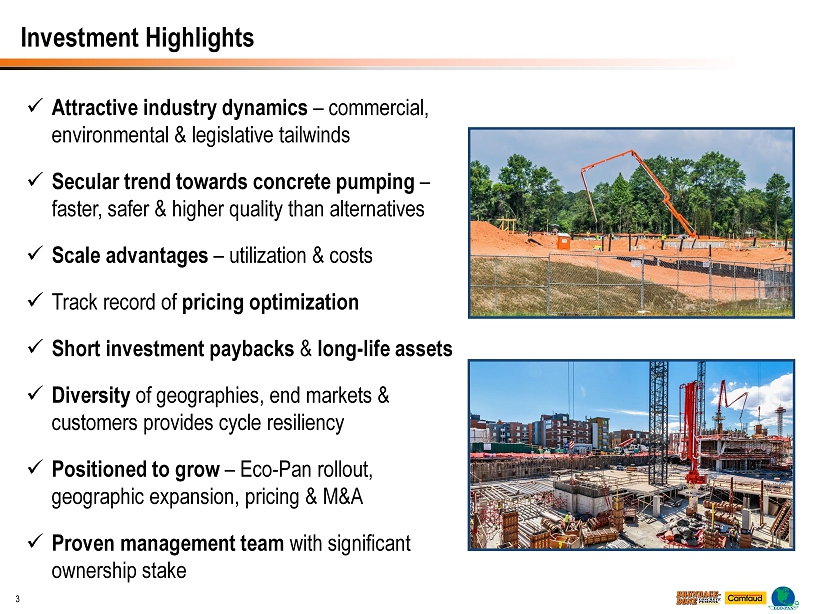
x Attractive industry dynamics – commercial, environmental & legislative tailwinds x Secular trend towards concrete pumping – faster, safer & higher quality than alternatives x Scale advantages – utilization & costs x Track record of pricing optimization x Short investment paybacks & long - life assets x Diversity of geographies, end markets & customers provides cycle resiliency x Positioned to grow – Eco - Pan rollout, geographic expansion, pricing & M&A x Proven management team with significant ownership stake Investment Highlights 3
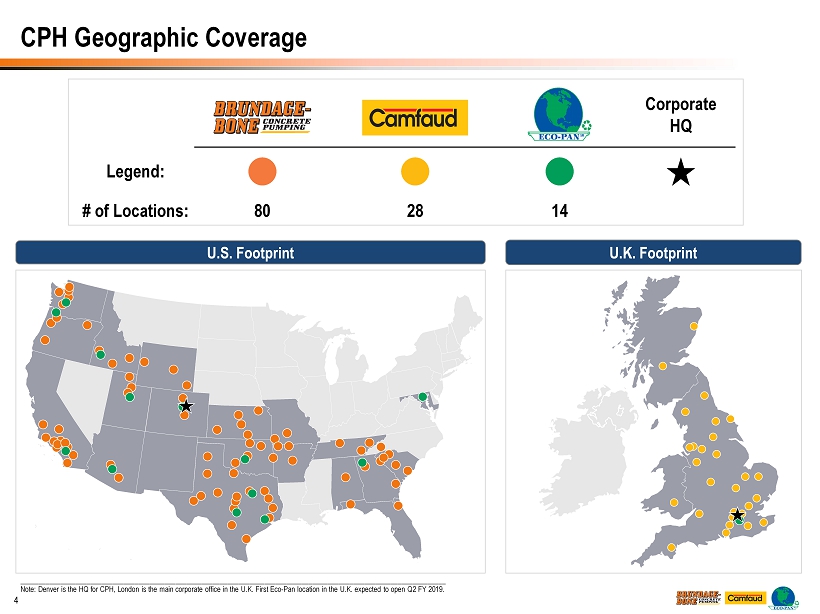
CPH Geographic Coverage 4 ___________________________________________________________________________________________________________________ Note: Denver is the HQ for CPH, London is the main corporate office in the U.K. First Eco - Pan location in the U.K. expected to o pen Q2 FY 2019. U.S. Footprint U.K. Footprint Legend: Corporate HQ # of Locations: 80 28 14
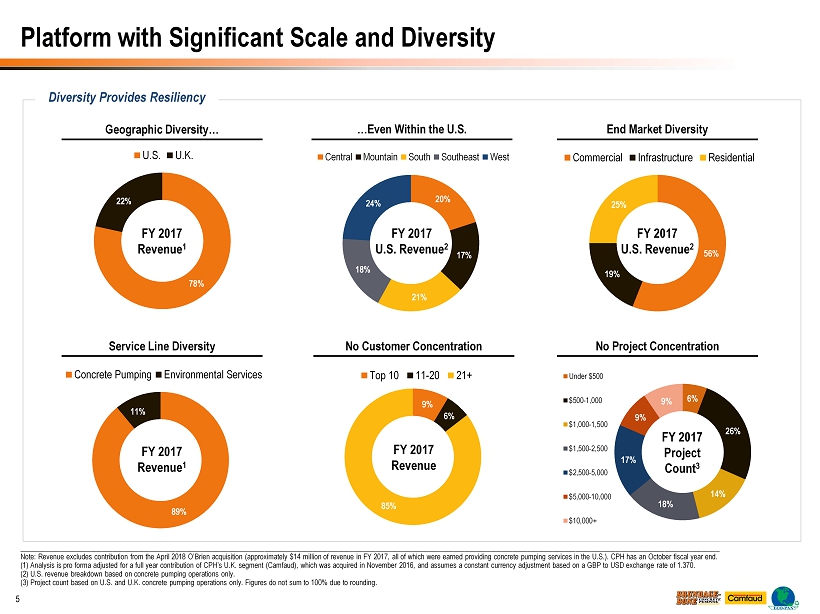
20% 17% 21% 18% 24% Central Mountain South Southeast West 6% 26% 14% 18% 17% 9% 9% Under $500 $500-1,000 $1,000-1,500 $1,500-2,500 $2,500-5,000 $5,000-10,000 $10,000+ No Project Concentration _____________________________________________________________________________________________________________________________ ___ _____________________________________________________________ Note: Revenue excludes contribution from the April 2018 O’Brien acquisition (approximately $14 million of revenue in FY 2017, al l of which were earned providing concrete pumping services in the U.S.). CPH has an October fiscal year end. (1) Analysis is pro forma adjusted for a full year contribution of CPH’s U.K. segment (Camfaud), which was acquired in Novemb er 2016, and assumes a constant currency adjustment based on a GBP to USD exchange rate of 1.370. (2) U.S. revenue breakdown based on concrete pumping operations only. (3) Project count based on U.S. and U.K. concrete pumping operations only. Figures do not sum to 100% due to rounding. Diversity Provides Resiliency Platform with Significant Scale and Diversity No Customer Concentration Geographic Diversity… 78% 22% U.S. U.K. FY 2017 Revenue 1 9% 6% 85% Top 10 11-20 21+ FY 2017 Revenue 56% 19% 25% Commercial Infrastructure Residential End Market Diversity 5 FY 2017 Project Count 3 Service Line Diversity 89% 11% Concrete Pumping Environmental Services FY 2017 Revenue 1 FY 2017 U.S. Revenue 2 …Even Within the U.S. FY 2017 U.S. Revenue 2
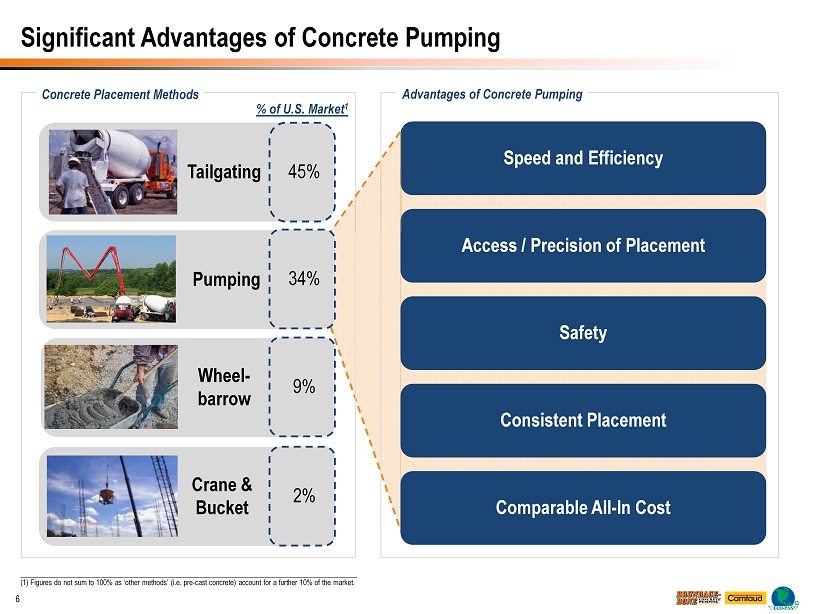
Significant Advantages of Concrete Pumping Crane & Bucket Wheel - barrow Concrete Placement Methods Tailgating Speed and Efficiency Access / Precision of Placement Safety Consistent Placement Advantages of Concrete Pumping ___________________________________________________________________________________________ (1) Figures do not sum to 100% as ‘other methods’ (i.e. pre - cast concrete) account for a further 10% of the market. 6 Comparable All - In Cost % of U.S. Market 1 45% 9% 2% Pumping 34%
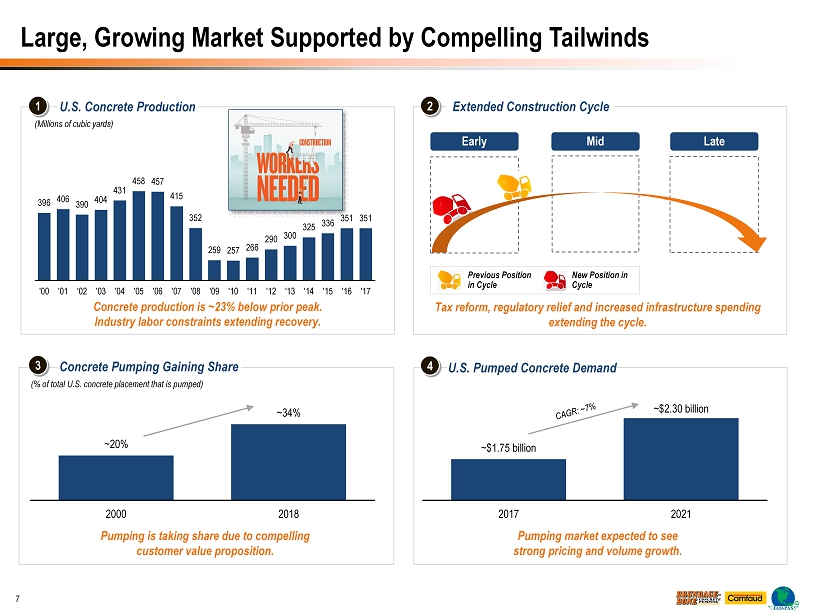
Concrete Pumping Gaining Share (% of total U.S. concrete placement that is pumped) Large, Growing Market Supported by Compelling Tailwinds U.S. Concrete Production (Millions of cubic yards) 396 406 390 404 431 458 457 415 352 259 257 266 290 300 325 336 351 351 '00 '01 '02 '03 '04 '05 '06 '07 '08 '09 '10 '11 '12 '13 '14 '15 '16 '17 Concrete production is ~23% below prior peak. Industry labor constraints extending recovery. U.S. Pumped Concrete Demand 7 Pumping is taking share due to compelling customer value proposition. 1 3 4 Pumping market expected to see strong pricing and volume growth. Extended Construction Cycle Tax reform, regulatory relief and increased infrastructure spending extending the cycle. 2 Early Mid Late New Position in Cycle Previous Position in Cycle ~20% ~34% 2000 2018 ~$1.75 billion ~$2.30 billion 2017 2021
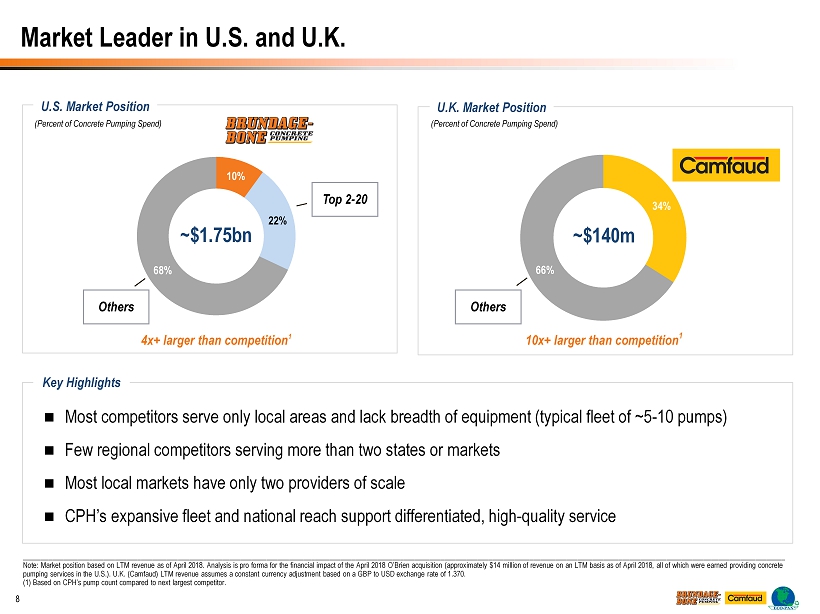
Market Leader in U.S. and U.K. U.S. Market Position (Percent of Concrete Pumping Spend) U.K. Market Position (Percent of Concrete Pumping Spend) 34% 66% ~$140m Others Key Highlights Most competitors serve only local areas and lack breadth of equipment (typical fleet of ~5 - 10 pumps) Few regional competitors serving more than two states or markets Most local markets have only two providers of scale CPH’s expansive fleet and national reach support differentiated, high - quality service 8 10% 22% 68% ~$1.75bn Others Top 2 - 20 _____________________________________________________________________________________________________________________________ ___ ______________________________________________________________________________ Note: Market position based on LTM revenue as of April 2018. Analysis is pro forma for the financial impact of the April 2018 O’ Brien acquisition (approximately $14 million of revenue on an LTM basis as of April 2018, all of which were earned providing con crete pumping services in the U.S.). U.K. (Camfaud) LTM revenue assumes a constant currency adjustment based on a GBP to USD exchan ge rate of 1.370. (1) Based on CPH’s pump count compared to next largest competitor. 4x+ larger than competition 1 10x+ larger than competition 1
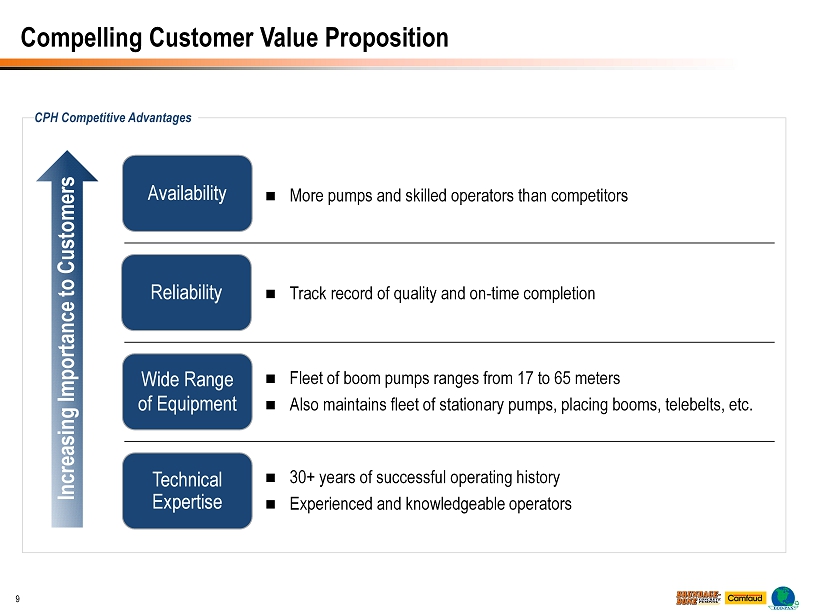
CPH Competitive Advantages Compelling Customer Value Proposition Increasing Importance to Customers Reliability Track record of quality and on - time completion Wide Range of Equipment Fleet of boom pumps ranges from 17 to 65 meters Also maintains fleet of stationary pumps, placing booms, telebelts, etc. Technical Expertise 30+ years of successful operating history Experienced and knowledgeable operators 9 Availability More pumps and skilled operators than competitors

Key Advantages of Business Model Services provided on a hourly and yardage poured basis, and include invoicing a travel charge Surcharge for any additional costs (such as fuel) High percentage of repeat customers plus strong referral network Simple Bidding Process Pure service business that doesn’t take title of ready - mix concrete No raw material price exposure No product liability risk Limited Project Risk No fixed price bid work and no percentage of completion accounting The daily pour, not the total project, is what is billed Variable Cost base provides flexibility across business environments No Fixed Price Projects No letter of credit or bonding exposure No Surety Bonding Requirements Negligible bad debt expense historically Typically one of the first trade contractors paid on the job Company invoices customers each day as the work is performed Limited Bad Debt Exposure CPH’s business model avoids issues common to typical contractors and construction service providers 10
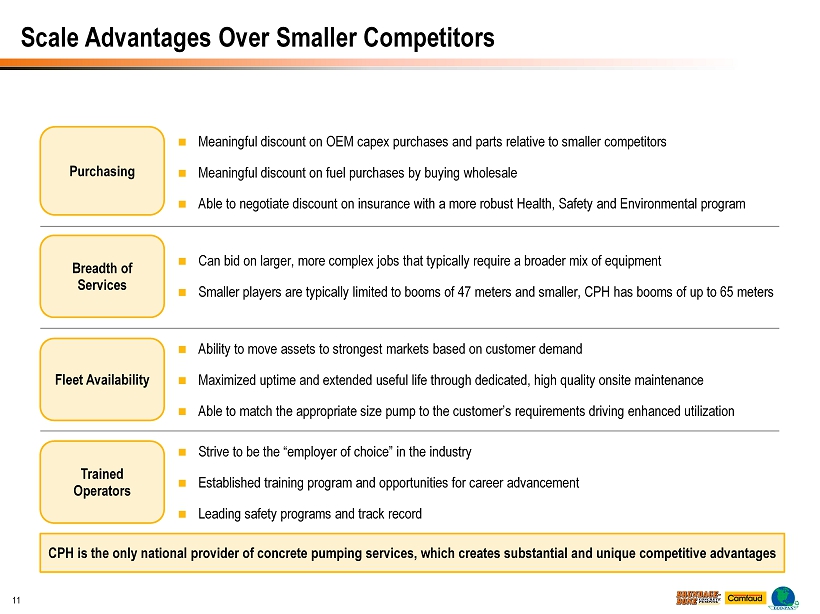
Meaningful discount on OEM capex purchases and parts relative to smaller competitors Meaningful discount on fuel purchases by buying wholesale Able to negotiate discount on insurance with a more robust Health, Safety and Environmental program Purchasing Can bid on larger, more complex jobs that typically require a broader mix of equipment Smaller players are typically limited to booms of 47 meters and smaller, CPH has booms of up to 65 meters Breadth of Services Ability to move assets to strongest markets based on customer demand Maximized uptime and extended useful life through dedicated, high quality onsite maintenance Able to match the appropriate size pump to the customer’s requirements driving enhanced utilization Fleet Availability Strive to be the “employer of choice” in the industry Established training program and opportunities for career advancement Leading safety programs and track record Trained Operators CPH is the only national provider of concrete pumping services, which creates substantial and unique competitive advantages Scale Advantages Over Smaller Competitors 11
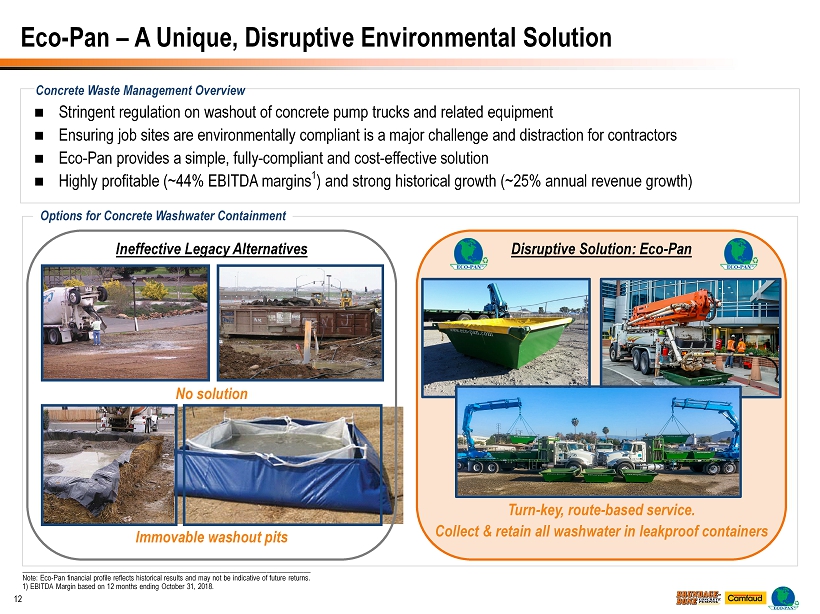
Eco - Pan – A Unique, Disruptive Environmental Solution ______________________________________________________________________________ Note: Eco - Pan financial profile reflects historical results and may not be indicative of future returns. 1) EBITDA Margin based on 12 months ending October 31, 2018. 12 Stringent regulation on washout of concrete pump trucks and related equipment Ensuring job sites are environmentally compliant is a major challenge and distraction for contractors Eco - Pan provides a simple, fully - compliant and cost - effective solution Highly profitable (~44% EBITDA margins 1 ) and strong historical growth (~25% annual revenue growth) Concrete Waste Management Overview Options for Concrete Washwater Containment Immovable washout pits Turn - key, route - based service. Collect & retain all washwater in leakproof containers No solution Ineffective Legacy Alternatives Disruptive Solution: Eco - Pan
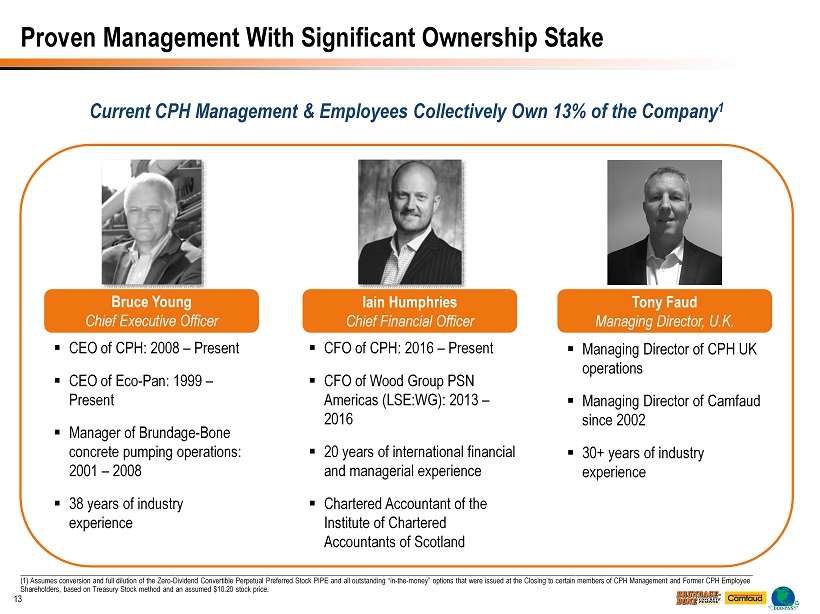
Bruce Young Chief Executive Officer ▪ CEO of CPH: 2008 – Present ▪ CEO of Eco - Pan: 1999 – Present ▪ Manager of Brundage - Bone concrete pumping operations: 2001 – 2008 ▪ 38 years of industry experience ▪ CFO of CPH: 2016 – Present ▪ CFO of Wood Group PSN Americas (LSE:WG): 2013 – 2016 ▪ 20 years of international financial and managerial experience ▪ Chartered Accountant of the Institute of Chartered Accountants of Scotland Proven Management With Significant Ownership Stake Iain Humphries Chief Financial Officer 13 ▪ Managing Director of CPH UK operations ▪ Managing Director of Camfaud since 2002 ▪ 30+ years of industry experience Tony Faud Managing Director, U.K. Current CPH Management & Employees Collectively Own 13% of the Company 1 _____________________________________________________________________________________________________________________________ ___ ______________________________________________________________________ (1) Assumes conversion and full dilution of the Zero - Dividend Convertible Perpetual Preferred Stock PIPE and all outstanding “in - the - money” options that were issued at the Closing to certain members of CPH Management and Former CPH Employee Shareholders, based on Treasury Stock method and an assumed $10.20 stock price.
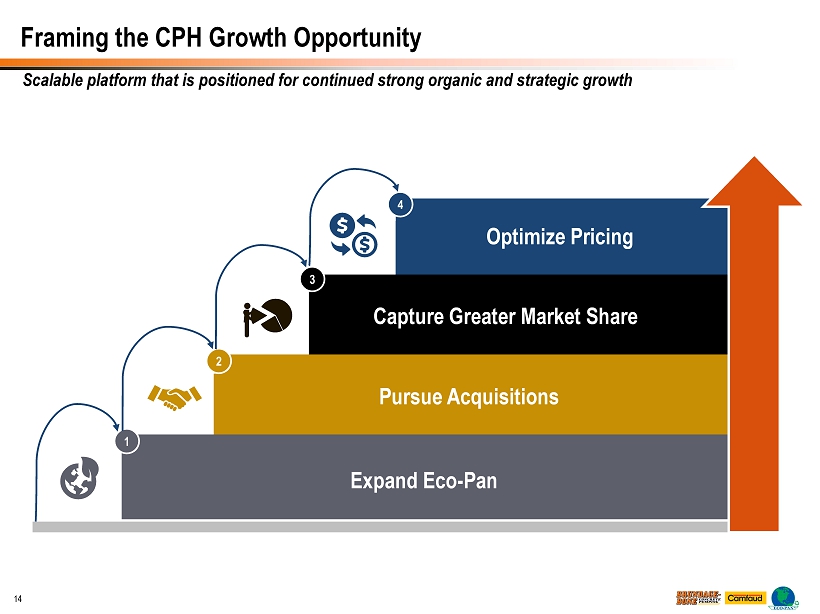
4 3 2 Framing the CPH Growth Opportunity 1 Scalable platform that is positioned for continued strong organic and strategic growth Expand Eco - Pan Pursue Acquisitions Capture Greater Market Share Optimize Pricing 14
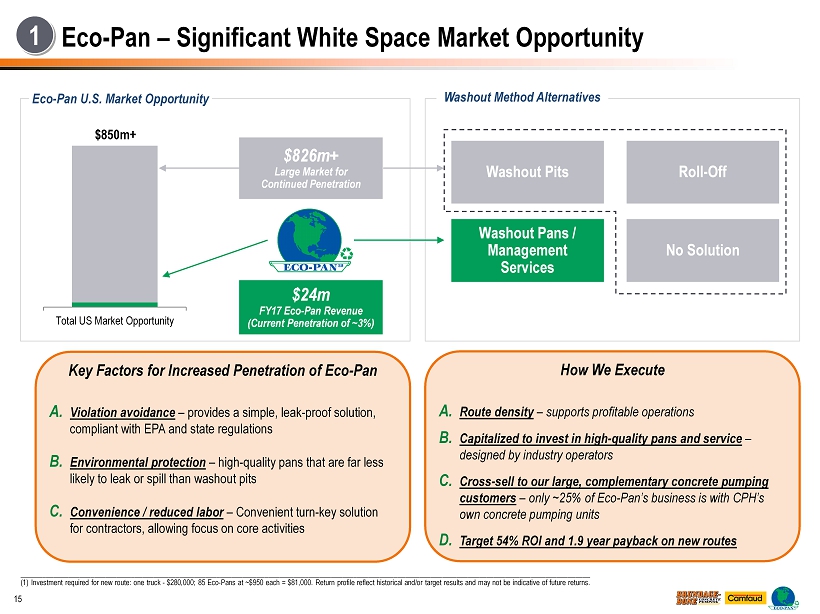
15 Eco - Pan – Significant White Space Market Opportunity 1 Eco - Pan U.S. Market Opportunity Total US Market Opportunity $850m+ $24m FY17 Eco - Pan Revenue (Current Penetration of ~3%) $826m+ Large Market for Continued Penetration Washout Method Alternatives Washout Pits Roll - Off No Solution Washout Pans / Management Services Key Factors for Increased Penetration of Eco - Pan A. Violation avoidance – provides a simple, leak - proof solution, compliant with EPA and state regulations B. Environmental protection – high - quality pans that are far less likely to leak or spill than washout pits C. Convenience / reduced labor – Convenient turn - key solution for contractors, allowing focus on core activities How We Execute A. Route density – supports profitable operations B. Capitalized to invest in high - quality pans and service – designed by industry operators C. Cross - sell to our large, complementary concrete pumping customers – only ~25% of Eco - Pan’s business is with CPH’s own concrete pumping units D. Target 54% ROI and 1.9 year payback on new routes _____________________________________________________________________________________________________________________________ ___ __________________________ (1) Investment required for new route: one truck - $280,000; 85 Eco - Pans at ~$950 each = $81,000. Return profile reflect historical and/or target results and may not be indicative of future returns.
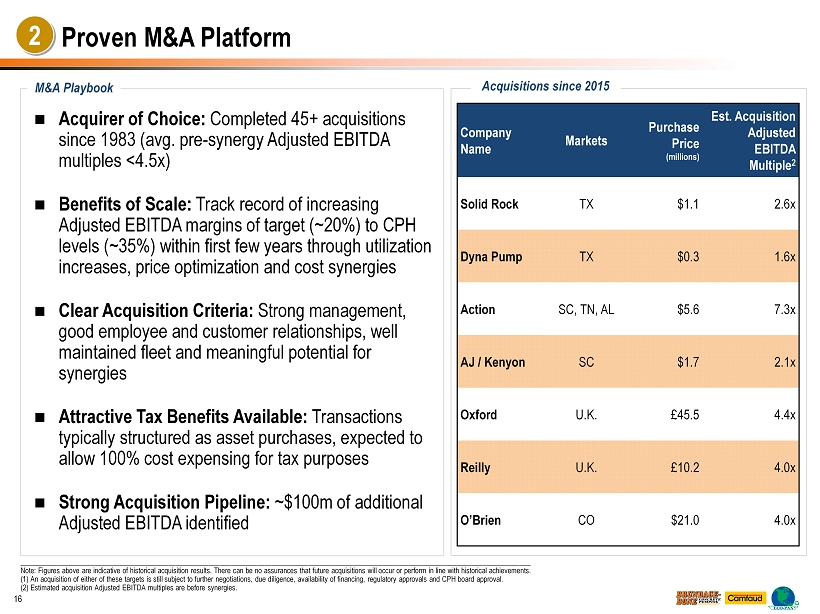
Acquirer of Choice: Completed 45+ acquisitions since 1983 (avg. pre - synergy Adjusted EBITDA multiples <4.5x) Benefits of Scale: Track record of increasing Adjusted EBITDA margins of target (~20%) to CPH levels (~35%) within first few years through utilization increases, price optimization and cost synergies Clear Acquisition Criteria: Strong management, good employee and customer relationships, well maintained fleet and meaningful potential for synergies Attractive Tax Benefits Available: Transactions typically structured as asset purchases, expected to allow 100% cost expensing for tax purposes Strong Acquisition Pipeline: ~$100m of additional Adjusted EBITDA identified Proven M&A Platform 2 _____________________________________________________________________________________________________________________________ ___ __________ Note: Figures above are indicative of historical acquisition results. There can be no assurances that future acquisitions wil l o ccur or perform in line with historical achievements. (1) An acquisition of either of these targets is still subject to further negotiations, due diligence, availability of financ ing , regulatory approvals and CPH board approval. (2) Estimated acquisition Adjusted EBITDA multiples are before synergies. 16 Company Name Markets Purchase Price (millions) Est. Acquisition Adjusted EBITDA Multiple 2 Solid Rock TX $1.1 2.6x Dyna Pump TX $0.3 1.6x Action SC, TN, AL $5.6 7.3x AJ / Kenyon SC $1.7 2.1x Oxford U.K. £ 45.5 4.4x Reilly U.K. £ 10.2 4.0x O’Brien CO $21.0 4.0x M&A Playbook Acquisitions since 2015
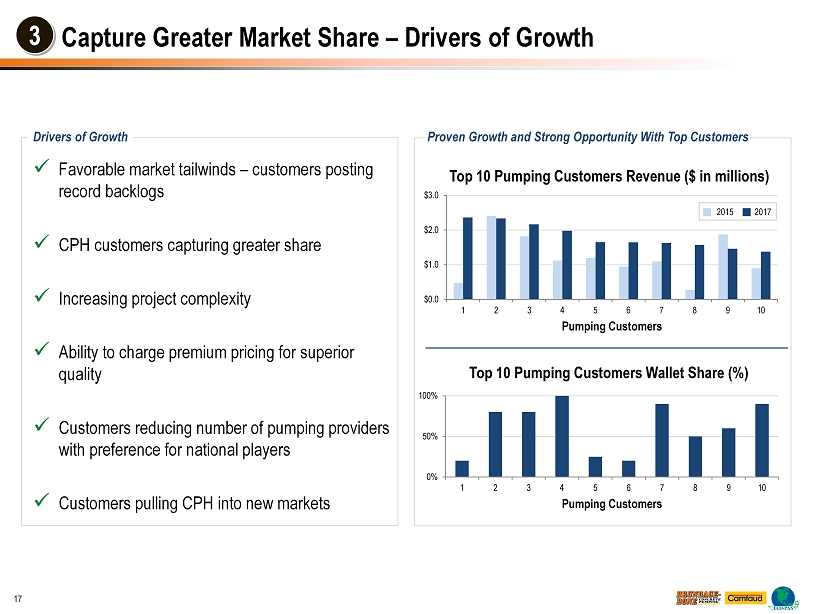
0% 50% 100% 1 2 3 4 5 6 7 8 9 10 Pumping Customers Capture Greater Market Share – Drivers of Growth 3 Drivers of Growth x Favorable market tailwinds – customers posting record backlogs x CPH customers capturing greater share x Increasing project complexity x Ability to charge premium pricing for superior quality x Customers reducing number of pumping providers with preference for national players x Customers pulling CPH into new markets 17 $0.0 $1.0 $2.0 $3.0 1 2 3 4 5 6 7 8 9 10 Pumping Customers Top 10 Pumping Customers Revenue ($ in millions) Top 10 Pumping Customers Wallet Share (%) 2015 2017 Proven Growth and Strong Opportunity With Top Customers
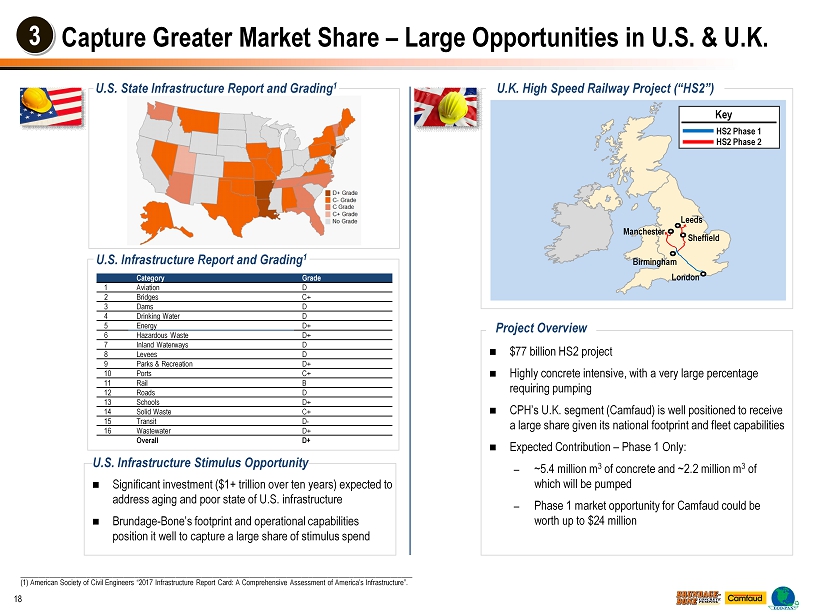
Capture Greater Market Share – Large Opportunities in U.S. & U.K. 18 $77 billion HS2 project Highly concrete intensive, with a very large percentage requiring pumping CPH’s U.K. segment (Camfaud) is well positioned to receive a large share given its national footprint and fleet capabilities Expected Contribution – Phase 1 Only: – ~5.4 million m 3 of concrete and ~2.2 million m 3 of which will be pumped – Phase 1 market opportunity for Camfaud could be worth up to $24 million __________________________________________________________________________________________________________ (1) American Society of Civil Engineers “2017 Infrastructure Report Card: A Comprehensive Assessment of America’s Infrastruct ure ”. U.K. High Speed Railway Project (“HS2”) Manchester Birmingham London Leeds Sheffield Key HS2 Phase 1 HS2 Phase 2 Project Overview U.S. State Infrastructure Report and Grading 1 U.S. Infrastructure Report and Grading 1 3 Category Grade 1 Aviation D 2 Bridges C+ 3 Dams D 4 Drinking Water D 5 Energy D+ 6 Hazardous Waste D+ 7 Inland Waterways D 8 Levees D 9 Parks & Recreation D+ 10 Ports C+ 11 Rail B 12 Roads D 13 Schools D+ 14 Solid Waste C+ 15 Transit D - 16 Wastewater D+ Overall D+ Significant investment ($1+ trillion over ten years) expected to address aging and poor state of U.S. infrastructure Brundage - Bone’s footprint and operational capabilities position it well to capture a large share of stimulus spend U.S. Infrastructure Stimulus Opportunity
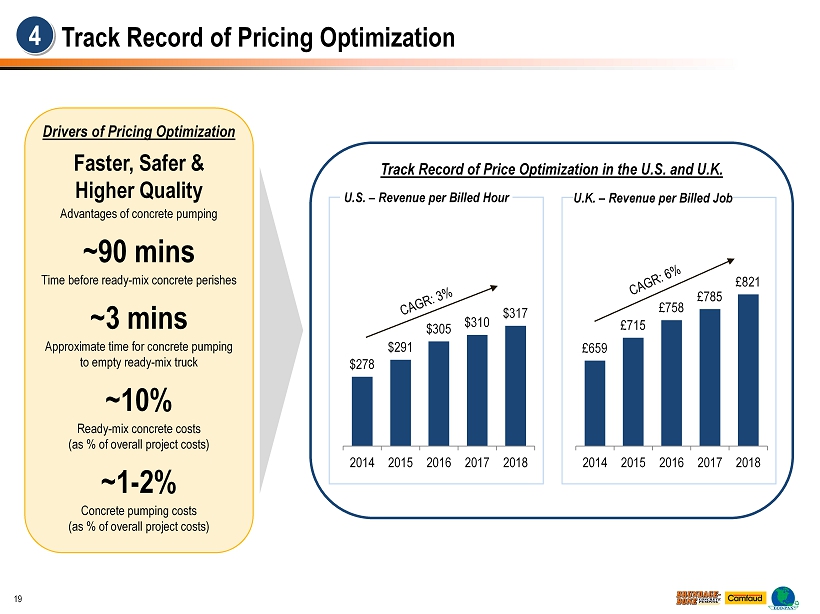
Track Record of Pricing Optimization Drivers of Pricing Optimization Faster, Safer & Higher Quality Advantages of concrete pumping ~90 mins Time before ready - mix concrete perishes ~3 mins Approximate time for concrete pumping to empty ready - mix truck ~10% Ready - mix concrete costs (as % of overall project costs) ~1 - 2% Concrete pumping costs (as % of overall project costs) 4 Track Record of Price Optimization in the U.S. and U.K. $278 $291 $305 $310 $317 2014 2015 2016 2017 2018 U.S. – Revenue per Billed Hour £659 £715 £758 £785 £821 2014 2015 2016 2017 2018 U.K. – Revenue per Billed Job 19
Concrete Pumping Holdings, Inc. Financial Overview
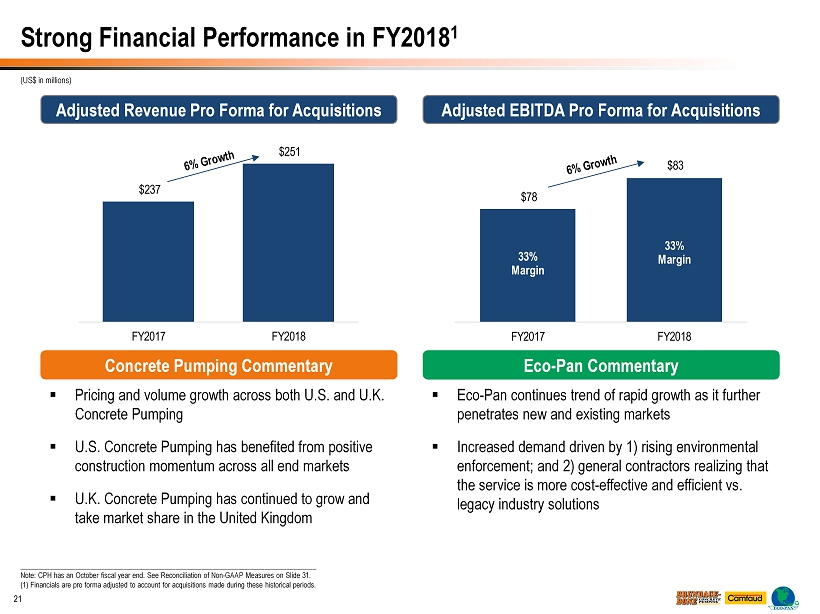
Strong Financial Performance in FY2018 1 21 Concrete Pumping Commentary ▪ Pricing and volume growth across both U.S. and U.K. Concrete Pumping ▪ U.S. Concrete Pumping has benefited from positive construction momentum across all end markets ▪ U.K. Concrete Pumping has continued to grow and take market share in the United Kingdom Adjusted Revenue Pro Forma for Acquisitions Adjusted EBITDA Pro Forma for Acquisitions ________________________________________________________________________________ Note: CPH has an October fiscal year end. See Reconciliation of Non - GAAP Measures on Slide 31. (1) Financials are pro forma adjusted to account for acquisitions made during these historical periods. ▪ Eco - Pan continues trend of rapid growth as it further penetrates new and existing markets ▪ Increased demand driven by 1) rising environmental enforcement; and 2) general contractors realizing that the service is more cost - effective and efficient vs. legacy industry solutions (US$ in millions) Eco - Pan Commentary $237 $251 FY2017 FY2018 $78 $83 FY2017 FY2018 33% Margin 33% Margin
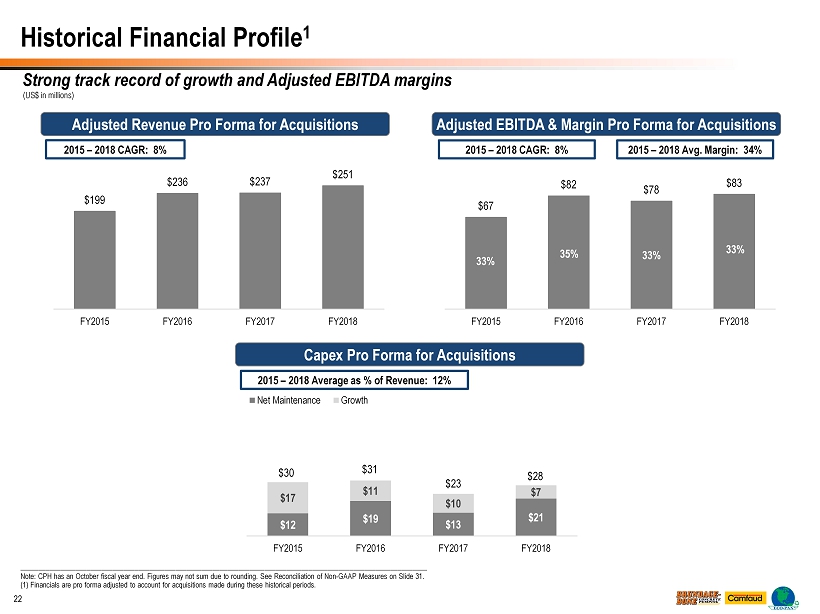
$12 $19 $13 $21 $17 $11 $10 $7 FY2015 FY2016 FY2017 FY2018 Net Maintenance Growth ______________________________________________________________________________________________________________ Note: CPH has an October fiscal year end. Figures may not sum due to rounding. See Reconciliation of Non - GAAP Measures on Slide 31. (1) Financials are pro forma adjusted to account for acquisitions made during these historical periods. $67 $82 $78 $83 FY2015 FY2016 FY2017 FY2018 $199 $236 $237 $251 FY2015 FY2016 FY2017 FY2018 Adjusted Revenue Pro Forma for Acquisitions Adjusted EBITDA & Margin Pro Forma for Acquisitions Capex Pro Forma for Acquisitions 2015 – 2018 CAGR: 8% 2015 – 2018 CAGR: 8% 2015 – 2018 Average as % of Revenue: 12% 33% 35% 33% 33% Historical Financial Profile 1 22 $31 $23 $28 Strong track record of growth and Adjusted EBITDA margins 2015 – 2018 Avg. Margin: 34% $30 (US$ in millions)
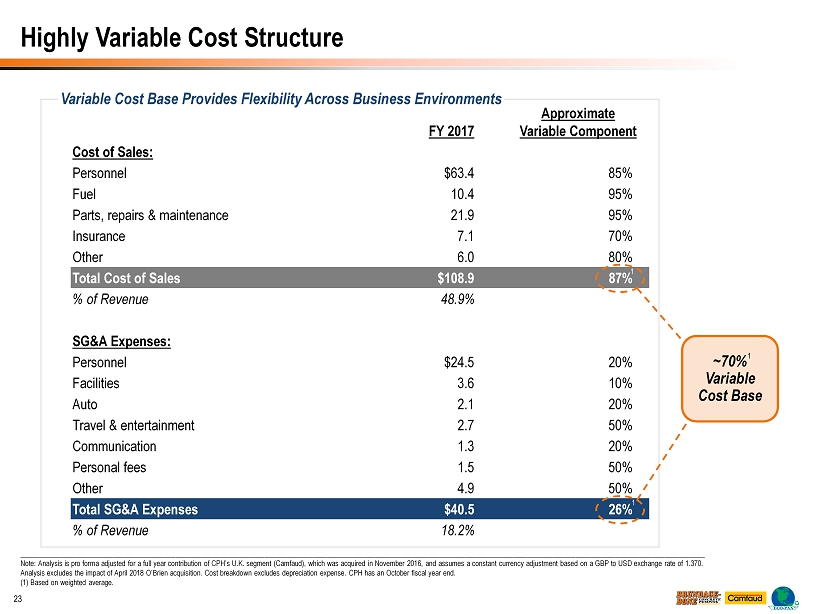
FY 2017 Approximate Variable Component Cost of Sales: Personnel $63.4 85% Fuel 10.4 95% Parts, repairs & maintenance 21.9 95% Insurance 7.1 70% Other 6.0 80% Total Cost of Sales $108.9 87% % of Revenue 48.9% SG&A Expenses: Personnel $24.5 20% Facilities 3.6 10% Auto 2.1 20% Travel & entertainment 2.7 50% Communication 1.3 20% Personal fees 1.5 50% Other 4.9 50% Total SG&A Expenses $40.5 26% % of Revenue 18.2% Variable Cost Base Provides Flexibility Across Business Environments 23 Highly Variable Cost Structure _____________________________________________________________________________________________________________________________ ___ _________________________________________________________ Note: Analysis is pro forma adjusted for a full year contribution of CPH’s U.K. segment (Camfaud), which was acquired in Nove mbe r 2016, and assumes a constant currency adjustment based on a GBP to USD exchange rate of 1.370. Analysis excludes the impact of April 2018 O’Brien acquisition. Cost breakdown excludes depreciation expense. CPH has an Octo ber fiscal year end. (1) Based on weighted average. ~70% Variable Cost Base 1 1 1
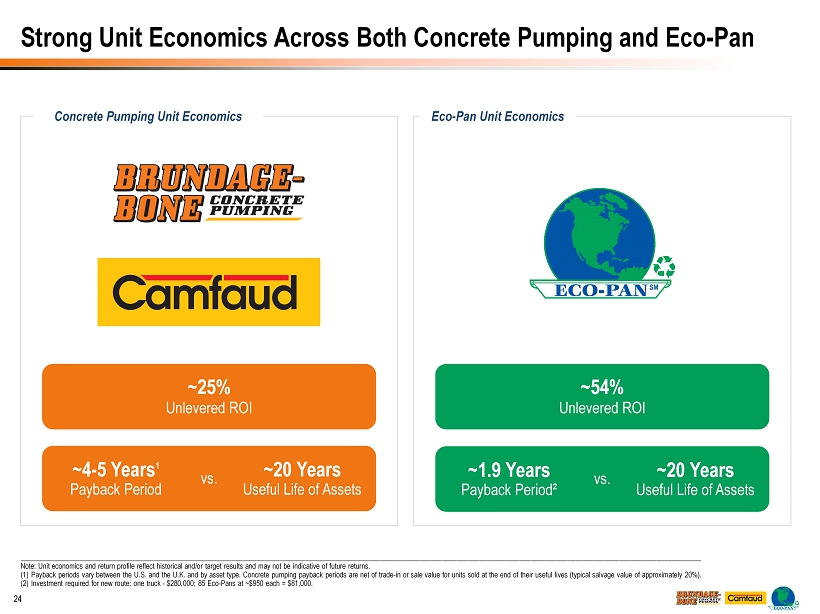
Strong Unit Economics Across Both Concrete Pumping and Eco - Pan 24 _____________________________________________________________________________________________________________________________ ___ ________________________________________________________ Note: Unit economics and return profile reflect historical and/or target results and may not be indicative of future returns. (1) Payback periods vary between the U.S. and the U.K. and by asset type. Concrete pumping payback periods are net of trade - in or sa le value for units sold at the end of their useful lives (typical salvage value of approximately 20%). (2) Investment required for new route: one truck - $280,000; 85 Eco - Pans at ~$950 each = $81,000. Concrete Pumping Unit Economics Eco - Pan Unit Economics ~54% Unlevered ROI vs. ~25% Unlevered ROI vs. ~4 - 5 Years 1 Payback Period ~20 Years Useful Life of Assets ~1.9 Years Payback Period² ~20 Years Useful Life of Assets
Concrete Pumping Holdings, Inc. Appendices
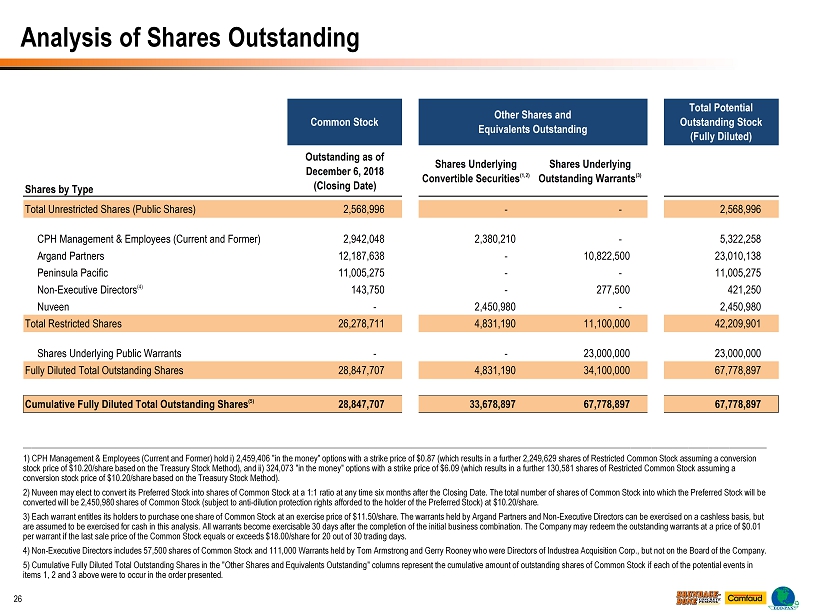
Analysis of Shares Outstanding 26 _____________________________________________________________________________________________________________________________ ___ ____________________________________________________ 1) CPH Management & Employees (Current and Former) hold i) 2,459,406 "in the money" options with a strike price of $0.87 (whi ch results in a further 2,249,629 shares of Restricted Common Stock assuming a conversion stock price of $10.20/share based on the Treasury Stock Method), and ii) 324,073 "in the money" options with a strike price o f $ 6.09 (which results in a further 130,581 shares of Restricted Common Stock assuming a conversion stock price of $10.20/share based on the Treasury Stock Method). 2) Nuveen may elect to convert its Preferred Stock into shares of Common Stock at a 1:1 ratio at any time six months after th e C losing Date. The total number of shares of Common Stock into which the Preferred Stock will be converted will be 2,450,980 shares of Common Stock (subject to anti - dilution protection rights afforded to the holder of the Pre ferred Stock) at $10.20/share. 3) Each warrant entitles its holders to purchase one share of Common Stock at an exercise price of $11.50/share. The warrants he ld by Argand Partners and Non - Executive Directors can be exercised on a cashless basis, but are assumed to be exercised for cash in this analysis. All warrants become exercisable 30 days after the completion of the in iti al business combination. The Company may redeem the outstanding warrants at a price of $0.01 per warrant if the last sale price of the Common Stock equals or exceeds $18.00/share for 20 out of 30 trading days. 4) Non - Executive Directors includes 57,500 shares of Common Stock and 111,000 Warrants held by Tom Armstrong and Gerry Rooney wh o were Directors of Industrea Acquisition Corp., but not on the Board of the Company. 5) Cumulative Fully Diluted Total Outstanding Shares in the "Other Shares and Equivalents Outstanding" columns represent the cum ulative amount of outstanding shares of Common Stock if each of the potential events in items 1, 2 and 3 above were to occur in the order presented. Common Stock Other Shares and Equivalents Outstanding Total Potential Outstanding Stock (Fully Diluted) Shares by Type Outstanding as of December 6, 2018 (Closing Date) Shares Underlying Convertible Securities (1,2) Shares Underlying Outstanding Warrants (3) Total Unrestricted Shares (Public Shares) 2,568,996 - - 2,568,996 CPH Management & Employees (Current and Former) 2,942,048 2,380,210 - 5,322,258 Argand Partners 12,187,638 - 10,822,500 23,010,138 Peninsula Pacific 11,005,275 - - 11,005,275 Non-Executive Directors (4) 143,750 - 277,500 421,250 Nuveen - 2,450,980 - 2,450,980 Total Restricted Shares 26,278,711 4,831,190 11,100,000 42,209,901 Shares Underlying Public Warrants - - 23,000,000 23,000,000 Fully Diluted Total Outstanding Shares 28,847,707 4,831,190 34,100,000 67,778,897 Cumulative Fully Diluted Total Outstanding Shares (5) 28,847,707 33,678,897 67,778,897 67,778,897
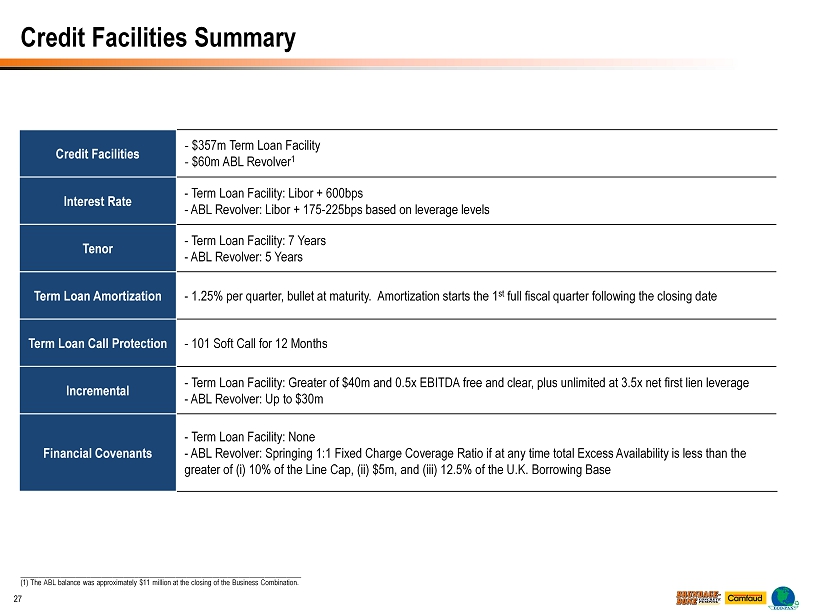
Credit Facilities - $357m Term Loan Facility - $60m ABL Revolver 1 Interest Rate - Term Loan Facility: Libor + 600bps - ABL Revolver: Libor + 175 - 225bps based on leverage levels Tenor - Term Loan Facility: 7 Years - ABL Revolver: 5 Years Term Loan Amortization - 1.25% per quarter, bullet at maturity. Amortization starts the 1 st full fiscal quarter following the closing date Term Loan Call Protection - 101 Soft Call for 12 Months Incremental - Term Loan Facility: Greater of $40m and 0.5x EBITDA free and clear, plus unlimited at 3.5x net first lien leverage - ABL Revolver: Up to $30m Financial Covenants - Term Loan Facility: None - ABL Revolver: Springing 1:1 Fixed Charge Coverage Ratio if at any time total Excess Availability is less than the greater of (i) 10% of the Line Cap, (ii) $5m, and (iii) 12.5% of the U.K. Borrowing Base Credit Facilities Summary 27 ____________________________________________________________________________ (1) The ABL balance was approximately $11 million at the closing of the Business Combination.
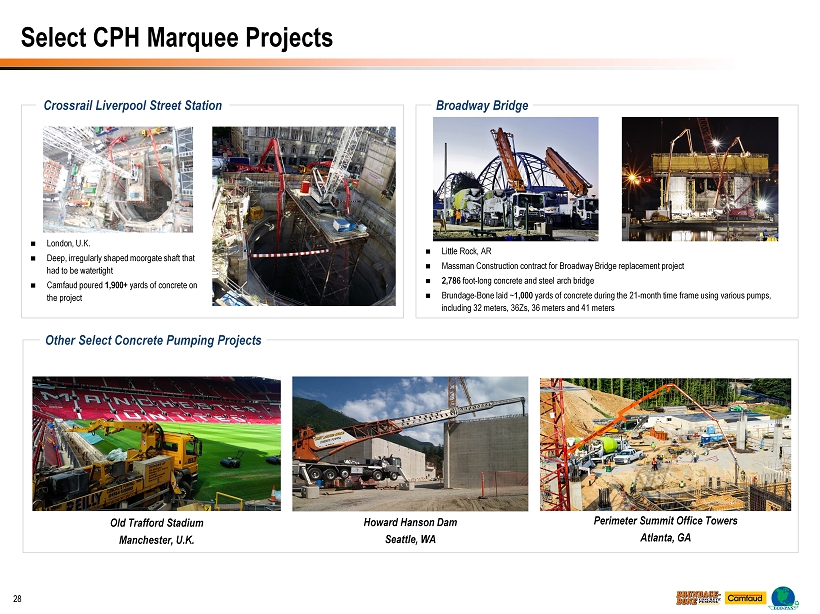
Select CPH Marquee Projects 28 Broadway Bridge Other Select Concrete Pumping Projects Crossrail Liverpool Street Station Little Rock, AR Massman Construction contract for Broadway Bridge replacement project 2,786 foot - long concrete and steel arch bridge Brundage - Bone laid ~ 1,000 yards of concrete during the 21 - month time frame using various pumps, including 32 meters, 36Zs, 36 meters and 41 meters London, U.K. Deep, irregularly shaped moorgate shaft that had to be watertight Camfaud poured 1,900+ yards of concrete on the project Howard Hanson Dam Seattle, WA Old Trafford Stadium Manchester, U.K. Perimeter Summit Office Towers Atlanta, GA
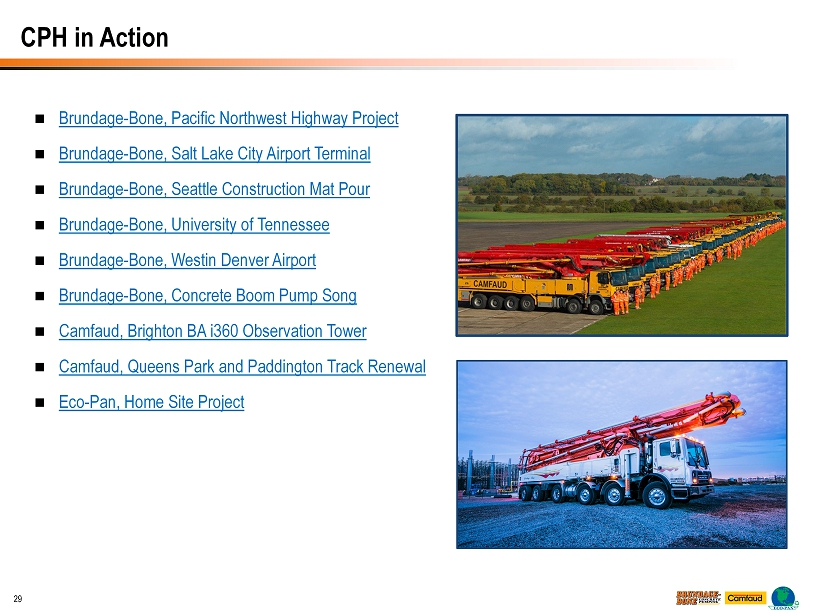
CPH in Action 29 Brundage - Bone, Pacific Northwest Highway Project Brundage - Bone, Salt Lake City Airport Terminal Brundage - Bone, Seattle Construction Mat Pour Brundage - Bone, University of Tennessee Brundage - Bone, Westin Denver Airport Brundage - Bone, Concrete Boom Pump Song Camfaud, Brighton BA i360 Observation Tower Camfaud, Queens Park and Paddington Track Renewal Eco - Pan, Home Site Project
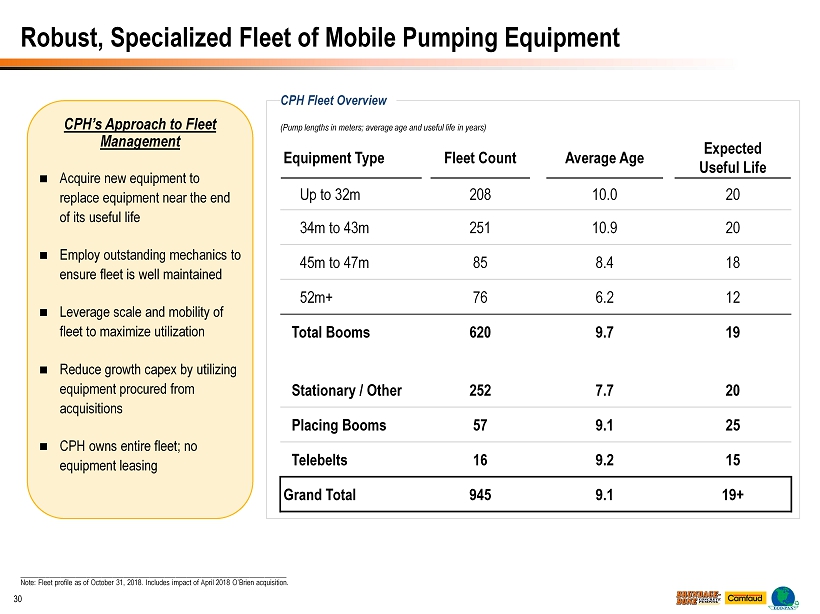
Robust, Specialized Fleet of Mobile Pumping Equipment 30 ________________________________________________________________________ Note: Fleet profile as of October 31, 2018. Includes impact of April 2018 O’Brien acquisition. CPH’s Approach to Fleet Management Acquire new equipment to replace equipment near the end of its useful life Employ outstanding mechanics to ensure fleet is well maintained Leverage scale and mobility of fleet to maximize utilization Reduce growth capex by utilizing equipment procured from acquisitions CPH owns entire fleet; no equipment leasing (Pump lengths in meters; average age and useful life in years) Equipment Type Fleet Count Average Age Expected Useful Life Up to 32m 208 10.0 20 34m to 43m 251 10.9 20 45m to 47m 85 8.4 18 52m+ 76 6.2 12 Total Booms 620 9.7 19 Stationary / Other 252 7.7 20 Placing Booms 57 9.1 25 Telebelts 16 9.2 15 Grand Total 945 9.1 19+ CPH Fleet Overview
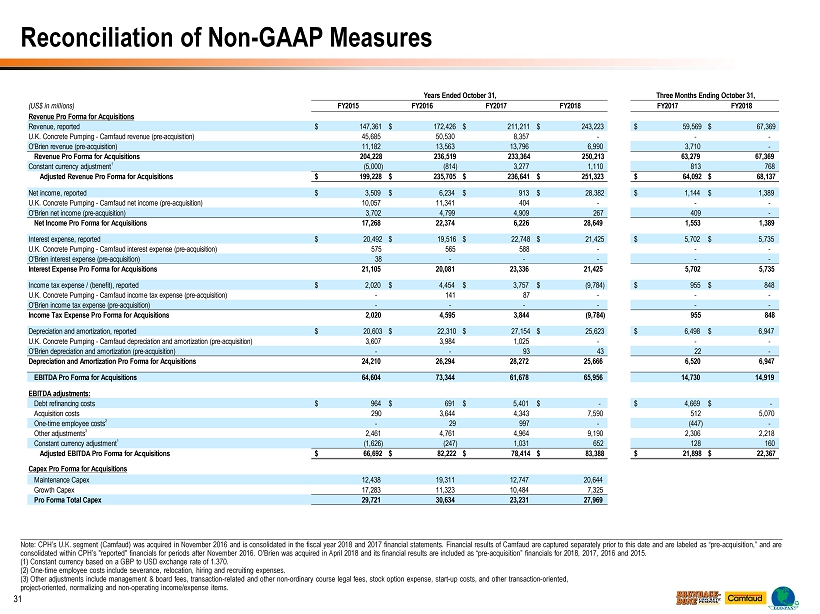
Reconciliation of Non - GAAP Measures 31 _____________________________________________________________________________________________________________________________ ___ ______________________________________________________________________________ Note: CPH’s U.K. segment (Camfaud) was acquired in November 2016 and is consolidated in the fiscal year 2018 and 2017 financi al statements. Financial results of Camfaud are captured separately prior to this date and are labeled as “pre - acquisition,” and ar e consolidated within CPH’s "reported" financials for periods after November 2016. O'Brien was acquired in April 2018 and its f ina ncial results are included as “pre - acquisition” financials for 2018, 2017, 2016 and 2015. (1) Constant currency based on a GBP to USD exchange rate of 1.370. (2) One - time employee costs include severance, relocation, hiring and recruiting expenses. (3) Other adjustments include management & board fees, transaction - related and other non - ordinary course legal fees, stock optio n expense, start - up costs, and other transaction - oriented, project - oriented, normalizing and non - operating income/expense items. Years Ended October 31, Three Months Ending October 31, (US$ in millions) FY2015 FY2016 FY2017 FY2018 FY2017 FY2018 Revenue Pro Forma for Acquisitions Revenue, reported $ 147,361 $ 172,426 $ 211,211 $ 243,223 $ 59,569 $ 67,369 U.K. Concrete Pumping - Camfaud revenue (pre-acquisition) 45,685 50,530 8,357 - - - O'Brien revenue (pre-acquisition) 11,182 13,563 13,796 6,990 3,710 - Revenue Pro Forma for Acquisitions 204,228 236,519 233,364 250,213 63,279 67,369 Constant currency adjustment 1 (5,000) (814) 3,277 1,110 813 768 Adjusted Revenue Pro Forma for Acquisitions $ 199,228 $ 235,705 $ 236,641 $ 251,323 $ 64,092 $ 68,137 Net income, reported $ 3,509 $ 6,234 $ 913 $ 28,382 $ 1,144 $ 1,389 U.K. Concrete Pumping - Camfaud net income (pre-acquisition) 10,057 11,341 404 - - - O'Brien net income (pre-acquisition) 3,702 4,799 4,909 267 409 - Net Income Pro Forma for Acquisitions 17,268 22,374 6,226 28,649 1,553 1,389 Interest expense, reported $ 20,492 $ 19,516 $ 22,748 $ 21,425 $ 5,702 $ 5,735 U.K. Concrete Pumping - Camfaud interest expense (pre-acquisition) 575 565 588 - - - O'Brien interest expense (pre-acquisition) 38 - - - - - Interest Expense Pro Forma for Acquisitions 21,105 20,081 23,336 21,425 5,702 5,735 Income tax expense / (benefit), reported $ 2,020 $ 4,454 $ 3,757 $ (9,784) $ 955 $ 848 U.K. Concrete Pumping - Camfaud income tax expense (pre-acquisition) - 141 87 - - - O'Brien income tax expense (pre-acquisition) - - - - - - Income Tax Expense Pro Forma for Acquisitions 2,020 4,595 3,844 (9,784) 955 848 Depreciation and amortization, reported $ 20,603 $ 22,310 $ 27,154 $ 25,623 $ 6,498 $ 6,947 U.K. Concrete Pumping - Camfaud depreciation and amortization (pre-acquisition) 3,607 3,984 1,025 - - - O'Brien depreciation and amortization (pre-acquisition) - - 93 43 22 - Depreciation and Amortization Pro Forma for Acquisitions 24,210 26,294 28,272 25,666 6,520 6,947 EBITDA Pro Forma for Acquisitions 64,604 73,344 61,678 65,956 14,730 14,919 EBITDA adjustments: Debt refinancing costs $ 964 $ 691 $ 5,401 $ - $ 4,669 $ - Acquisition costs 290 3,644 4,343 7,590 512 5,070 One-time employee costs 2 - 29 997 - (447) - Other adjustments 3 2,461 4,761 4,964 9,190 2,306 2,218 Constant currency adjustment 1 (1,626) (247) 1,031 652 128 160 Adjusted EBITDA Pro Forma for Acquisitions $ 66,692 $ 82,222 $ 78,414 $ 83,388 $ 21,898 $ 22,367 Capex Pro Forma for Acquisitions Maintenance Capex 12,438 19,311 12,747 20,644 Growth Capex 17,283 11,323 10,484 7,325 Pro Forma Total Capex 29,721 30,634 23,231 27,969
Corporate Headquarters Investor Relations 6461 Downing St. Liolios Group Denver, CO 80229 Cody Slach concretepumpingholdings.com 949 - 574 - 3860 BBCP@Liolios.com